Infographic IST
Designing an infographic that translates gender balance data into visual insights.
Information Design, Data Visualization, Editorial Design & Illustration
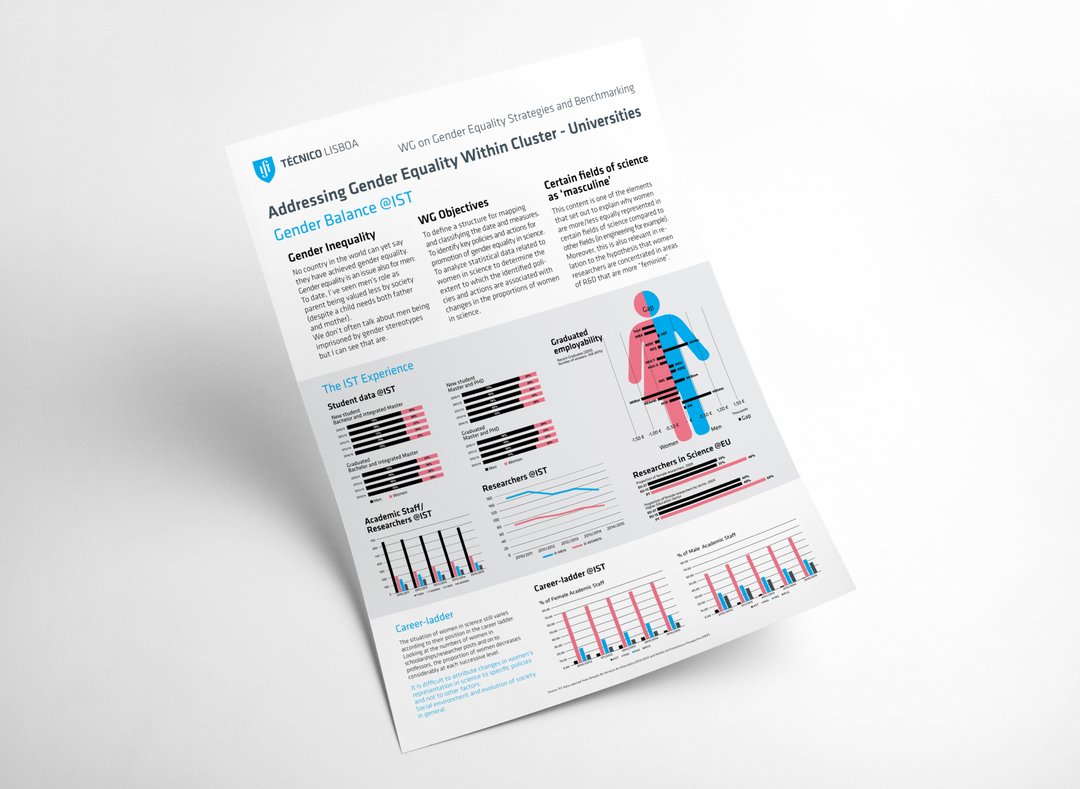
The infographic explores gender equality within academic and research contexts, translating complex datasets into a clear and structured visual system. Working from raw data provided in spreadsheets, the process focused on organizing information and identifying the most effective ways to communicate comparisons and key insights.
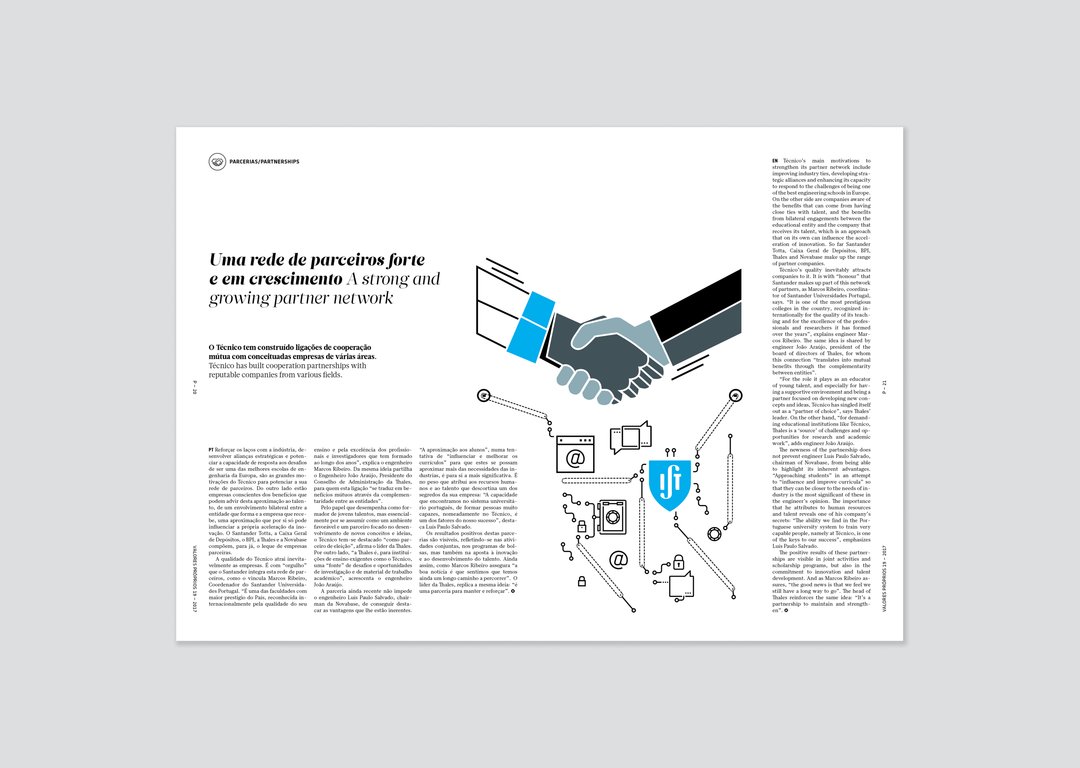
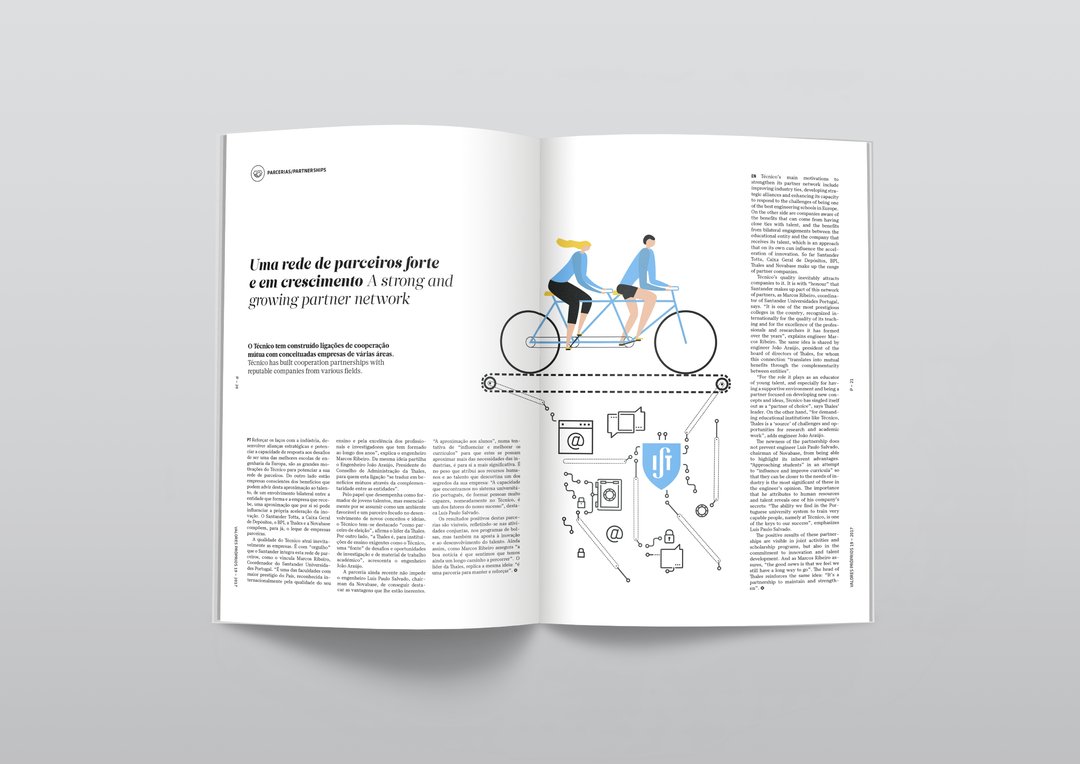
The project also included illustrations highlighting the institution’s network of partnerships, reinforcing the editorial narrative through a cohesive visual language.